
Reports & Dashboards
Turn monitoring data into clear reports and dashboards for your team and your customers.
On-demand and scheduled reports
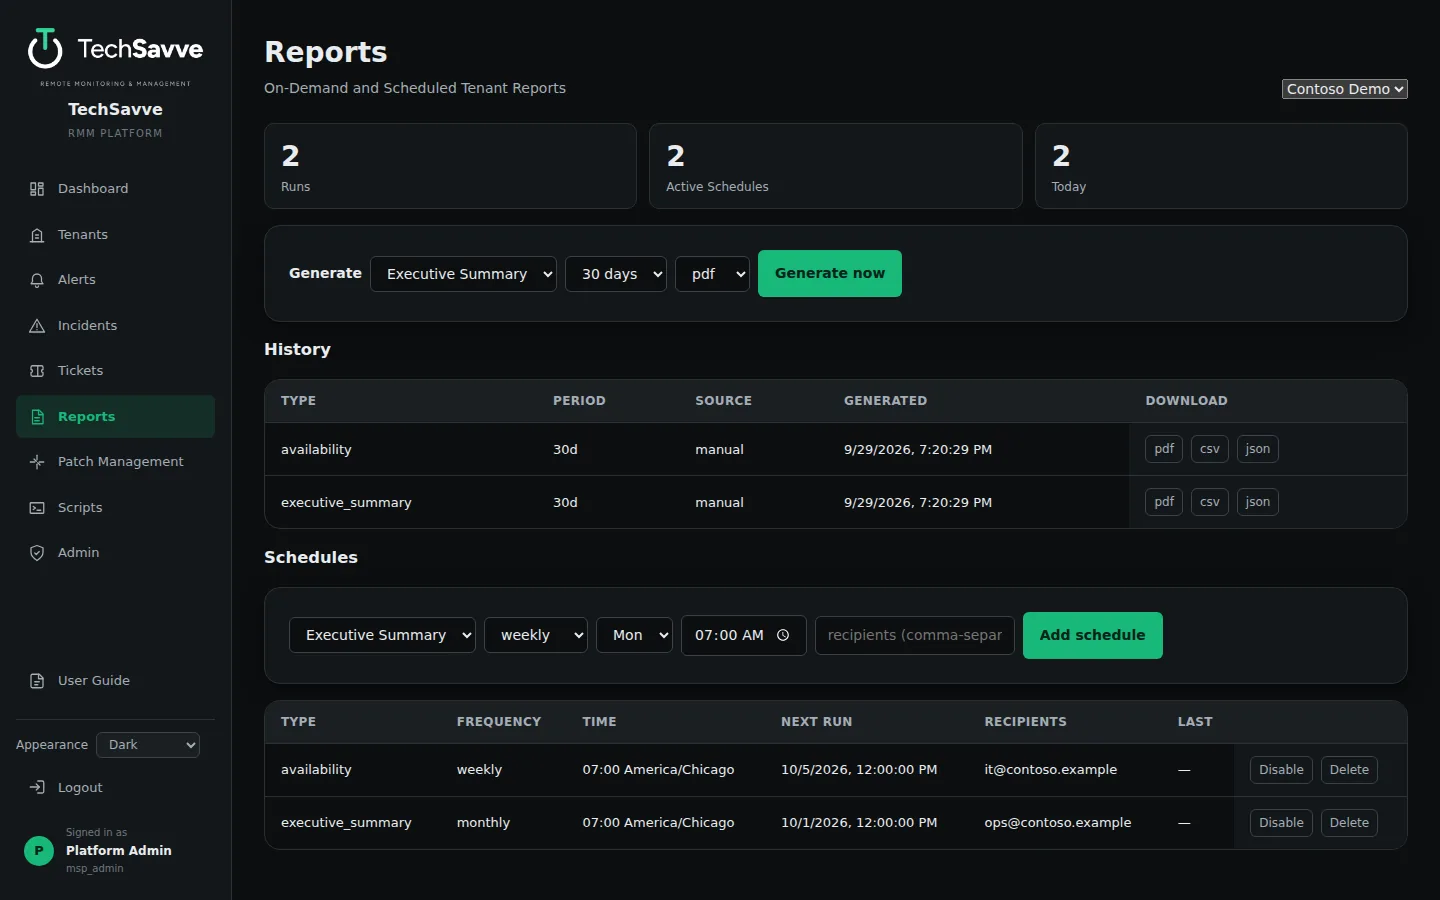
Reports clients actually read
Availability report
Per-monitor and per-site uptime, outage count and duration, and response times.
Executive summary
Inventory, availability, incidents by severity and mean time to resolve on one page.
Bandwidth usage
Traffic for each device and interface by day, month, quarter or year, from routers, switches, servers and PCs.
PDF, CSV or JSON
Download any report in the format that suits you. Every run is stored as an immutable snapshot.
Scheduled delivery
Run reports daily, weekly, monthly, quarterly or yearly and email them automatically.
Performance graphs
Charts of every reading over the last four hours to the last 30 days, and Graph Explorer for comparing hosts and finding the noisiest alerts.
Service availability
How each business service did over time, the way your customer sees it.
Custom dashboards
Each user arranges their own live dashboard widgets, including uptime by customer and site.
Themes
Dark, Light and Color Blind display themes.
Quarterly business reviews New
One click builds a customer’s business review as a PDF or an editable PowerPoint, ready to walk through in a meeting.
A health score
A single score from A to F built from availability, incidents, patching, backups, hardware and security, compared with the last review. Parts with nothing to measure are left out, not counted as perfect.
What happened
Uptime by site, incidents, patching and backups, and the risks worth acting on, such as systems that are out of support.
Problems solved before you noticed
Every automatic fix, from auto-remediation and runbooks, is counted and listed, so the work nobody saw is visible.
Scheduled or on demand
Generate last quarter in one click, or schedule it monthly, quarterly or yearly and have it emailed.
Ten more reports
Built on the same layout, so every one exports to PDF or CSV and can be scheduled and emailed.
Inventory and assets
Every device with its hardware and software, plus age, warranty and support status.
Capacity
Disks and storage that are filling up, and by when.
Patching
What is missing, what was installed and what failed.
Backups
Which backups ran, which failed and which devices have none.
Web and certificates
Site availability and certificate expiry for the sites and services you watch.
Alert noise
What fires most, what clears itself, and the tuning suggestions that would quiet it.
Service desk and SLA
Tickets opened and closed, response and resolution against SLA.
Time and billing
Hours worked, billable and billed.
Security
Findings from the compliance checks, ready to hand to a customer.
See TechSavve RMM in action
Book a free demo with the DFWTechPros team.